Sales Reports
Three reports that look at sales from different angles.
| Report | In one line |
|---|---|
| Sales by Customer | Revenue grouped by customer |
| Sales by Product | Revenue and quantity by product |
| Sales Master | Line-level master sales register |
Sales by Customer
Sales grouped by customer.
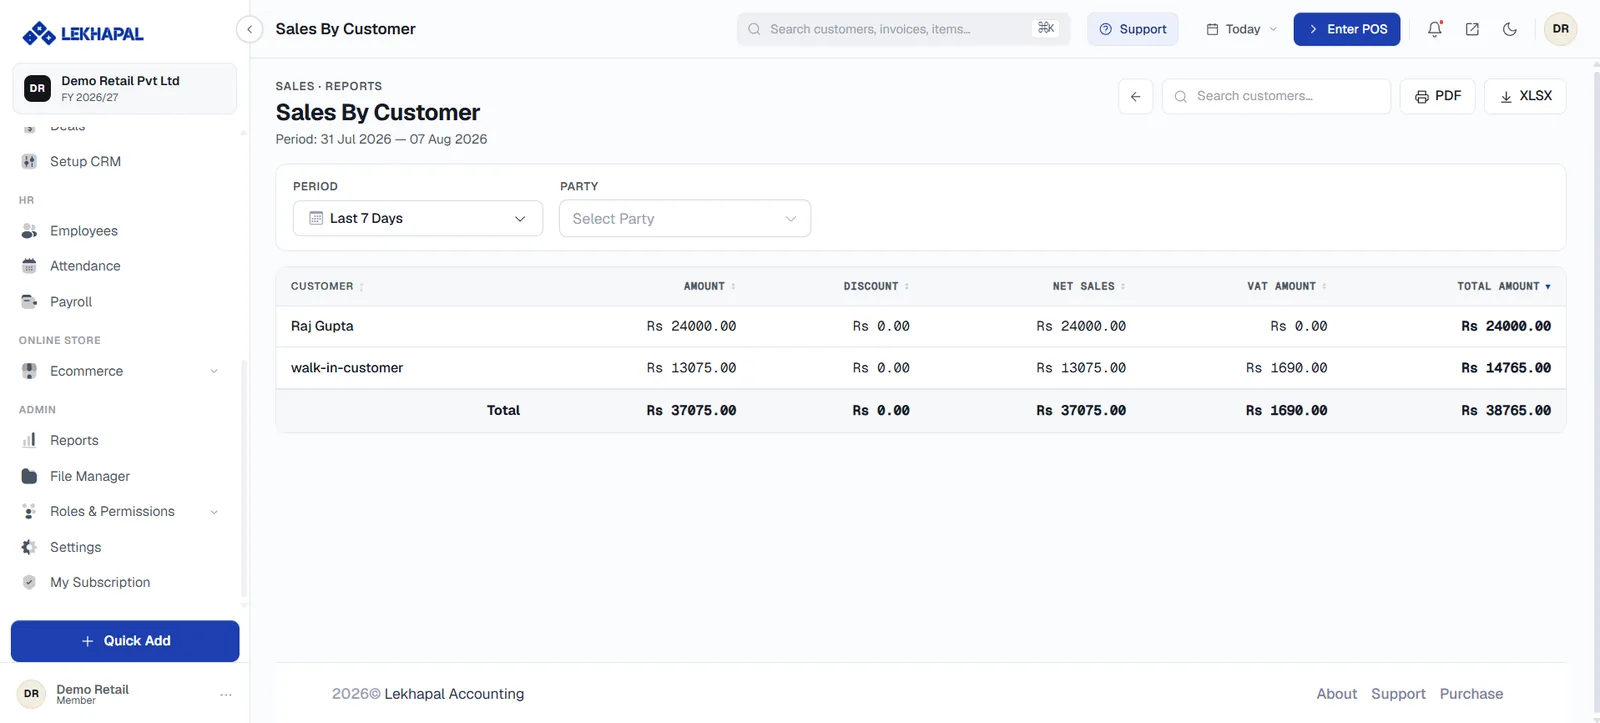
What it tells you
- How much each customer purchased.
- Which customers generate the most revenue.
- Customer-wise sales performance over the period.
Example. ABC Traders bought Rs. 200,000 of goods and XYZ Traders bought Rs. 100,000. The report shows both, ranked, so you can see where your revenue actually comes from.
Sales by Product
Sales broken down by individual product.
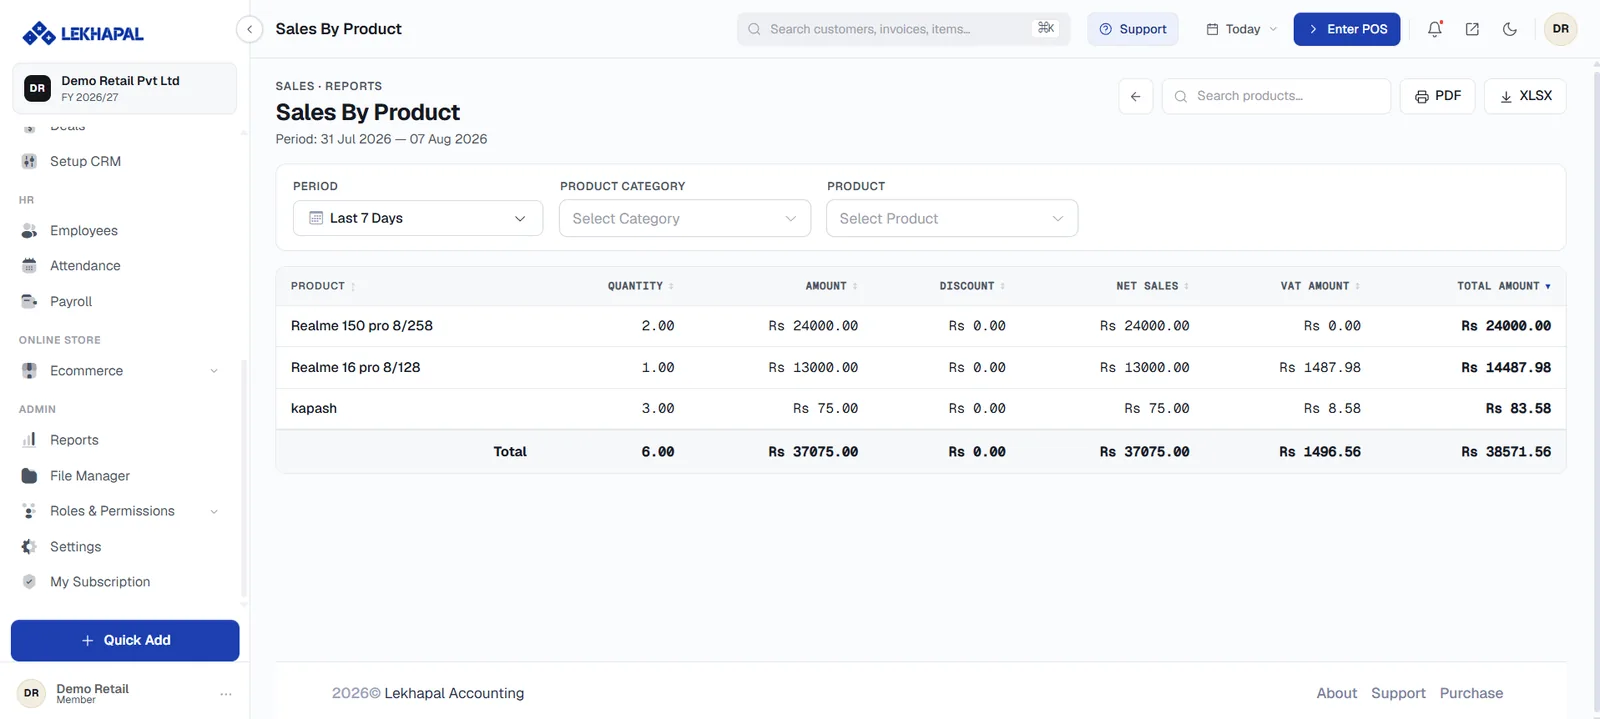
What it tells you
- Revenue generated by each product.
- Quantity sold.
Example. A shop sells laptops, monitors and keyboards. This report shows which are moving and how much revenue each brings in — which is what you want before deciding what to reorder.
Revenue is not profit
This report shows what each product sold for. For what each product earned, use the Product Profitability Report, which factors in cost.
Sales Master
A detailed, line-level sales register.
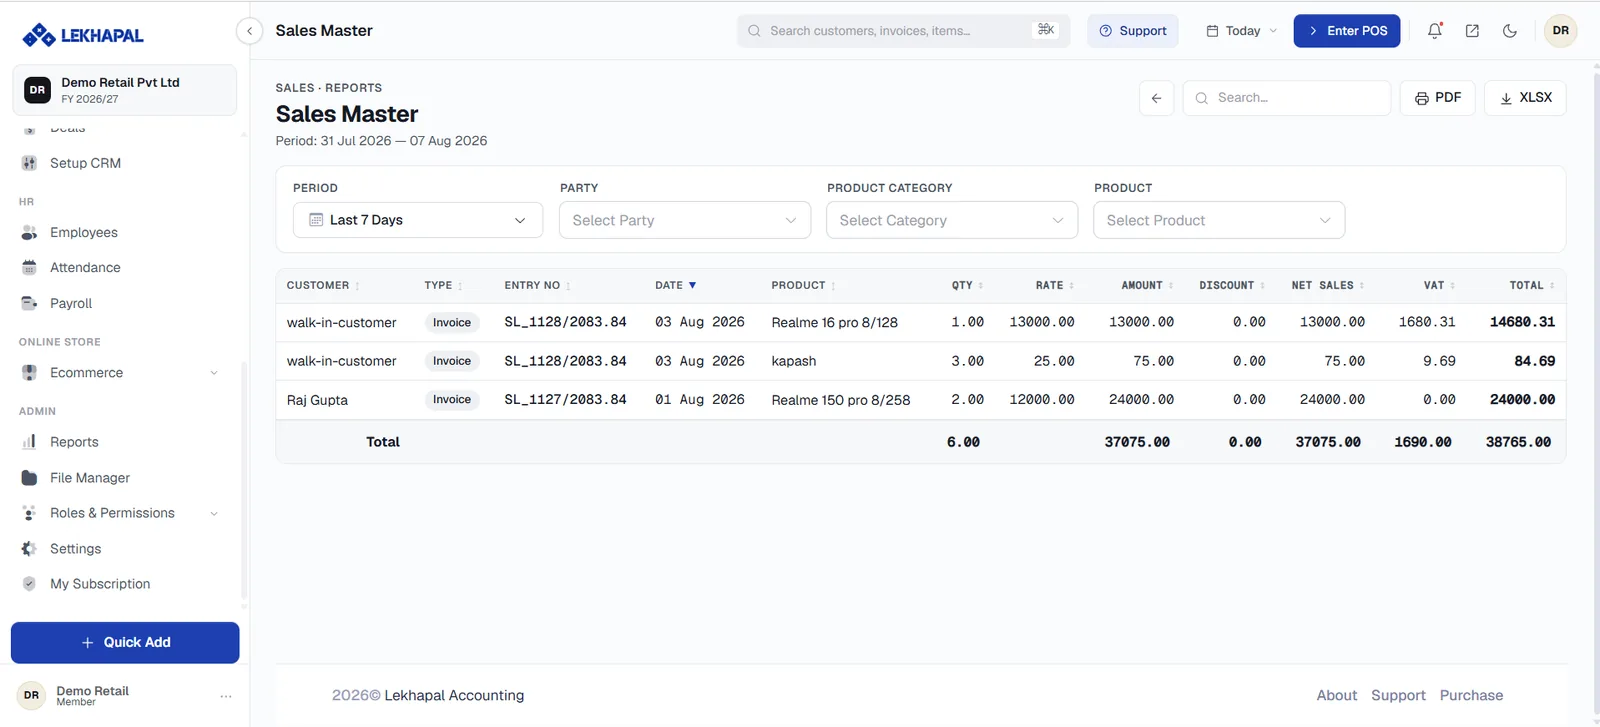
Unlike a summary, the Sales Master lets you examine sales at the individual line-item level — every product line on every invoice, in one register.
Use it when you need the underlying data: reconciling a period, investigating a discrepancy, or exporting to XLSX for your own analysis.